How it works
You already run a test suite on every commit and trust what it says about the code. Knilb does the same for the whole connected product: one plan across the cloud service, the gateway, the device, and the test equipment on the bench, run on demand, with an answer that means the same thing every time.
Authoring in the web app
You author in the web app: describe each part of the product by its API, then write one plan against all of them.
The documentation covers every screen and command, and the tutorial takes you to a first green result in about twenty minutes, with no hardware.
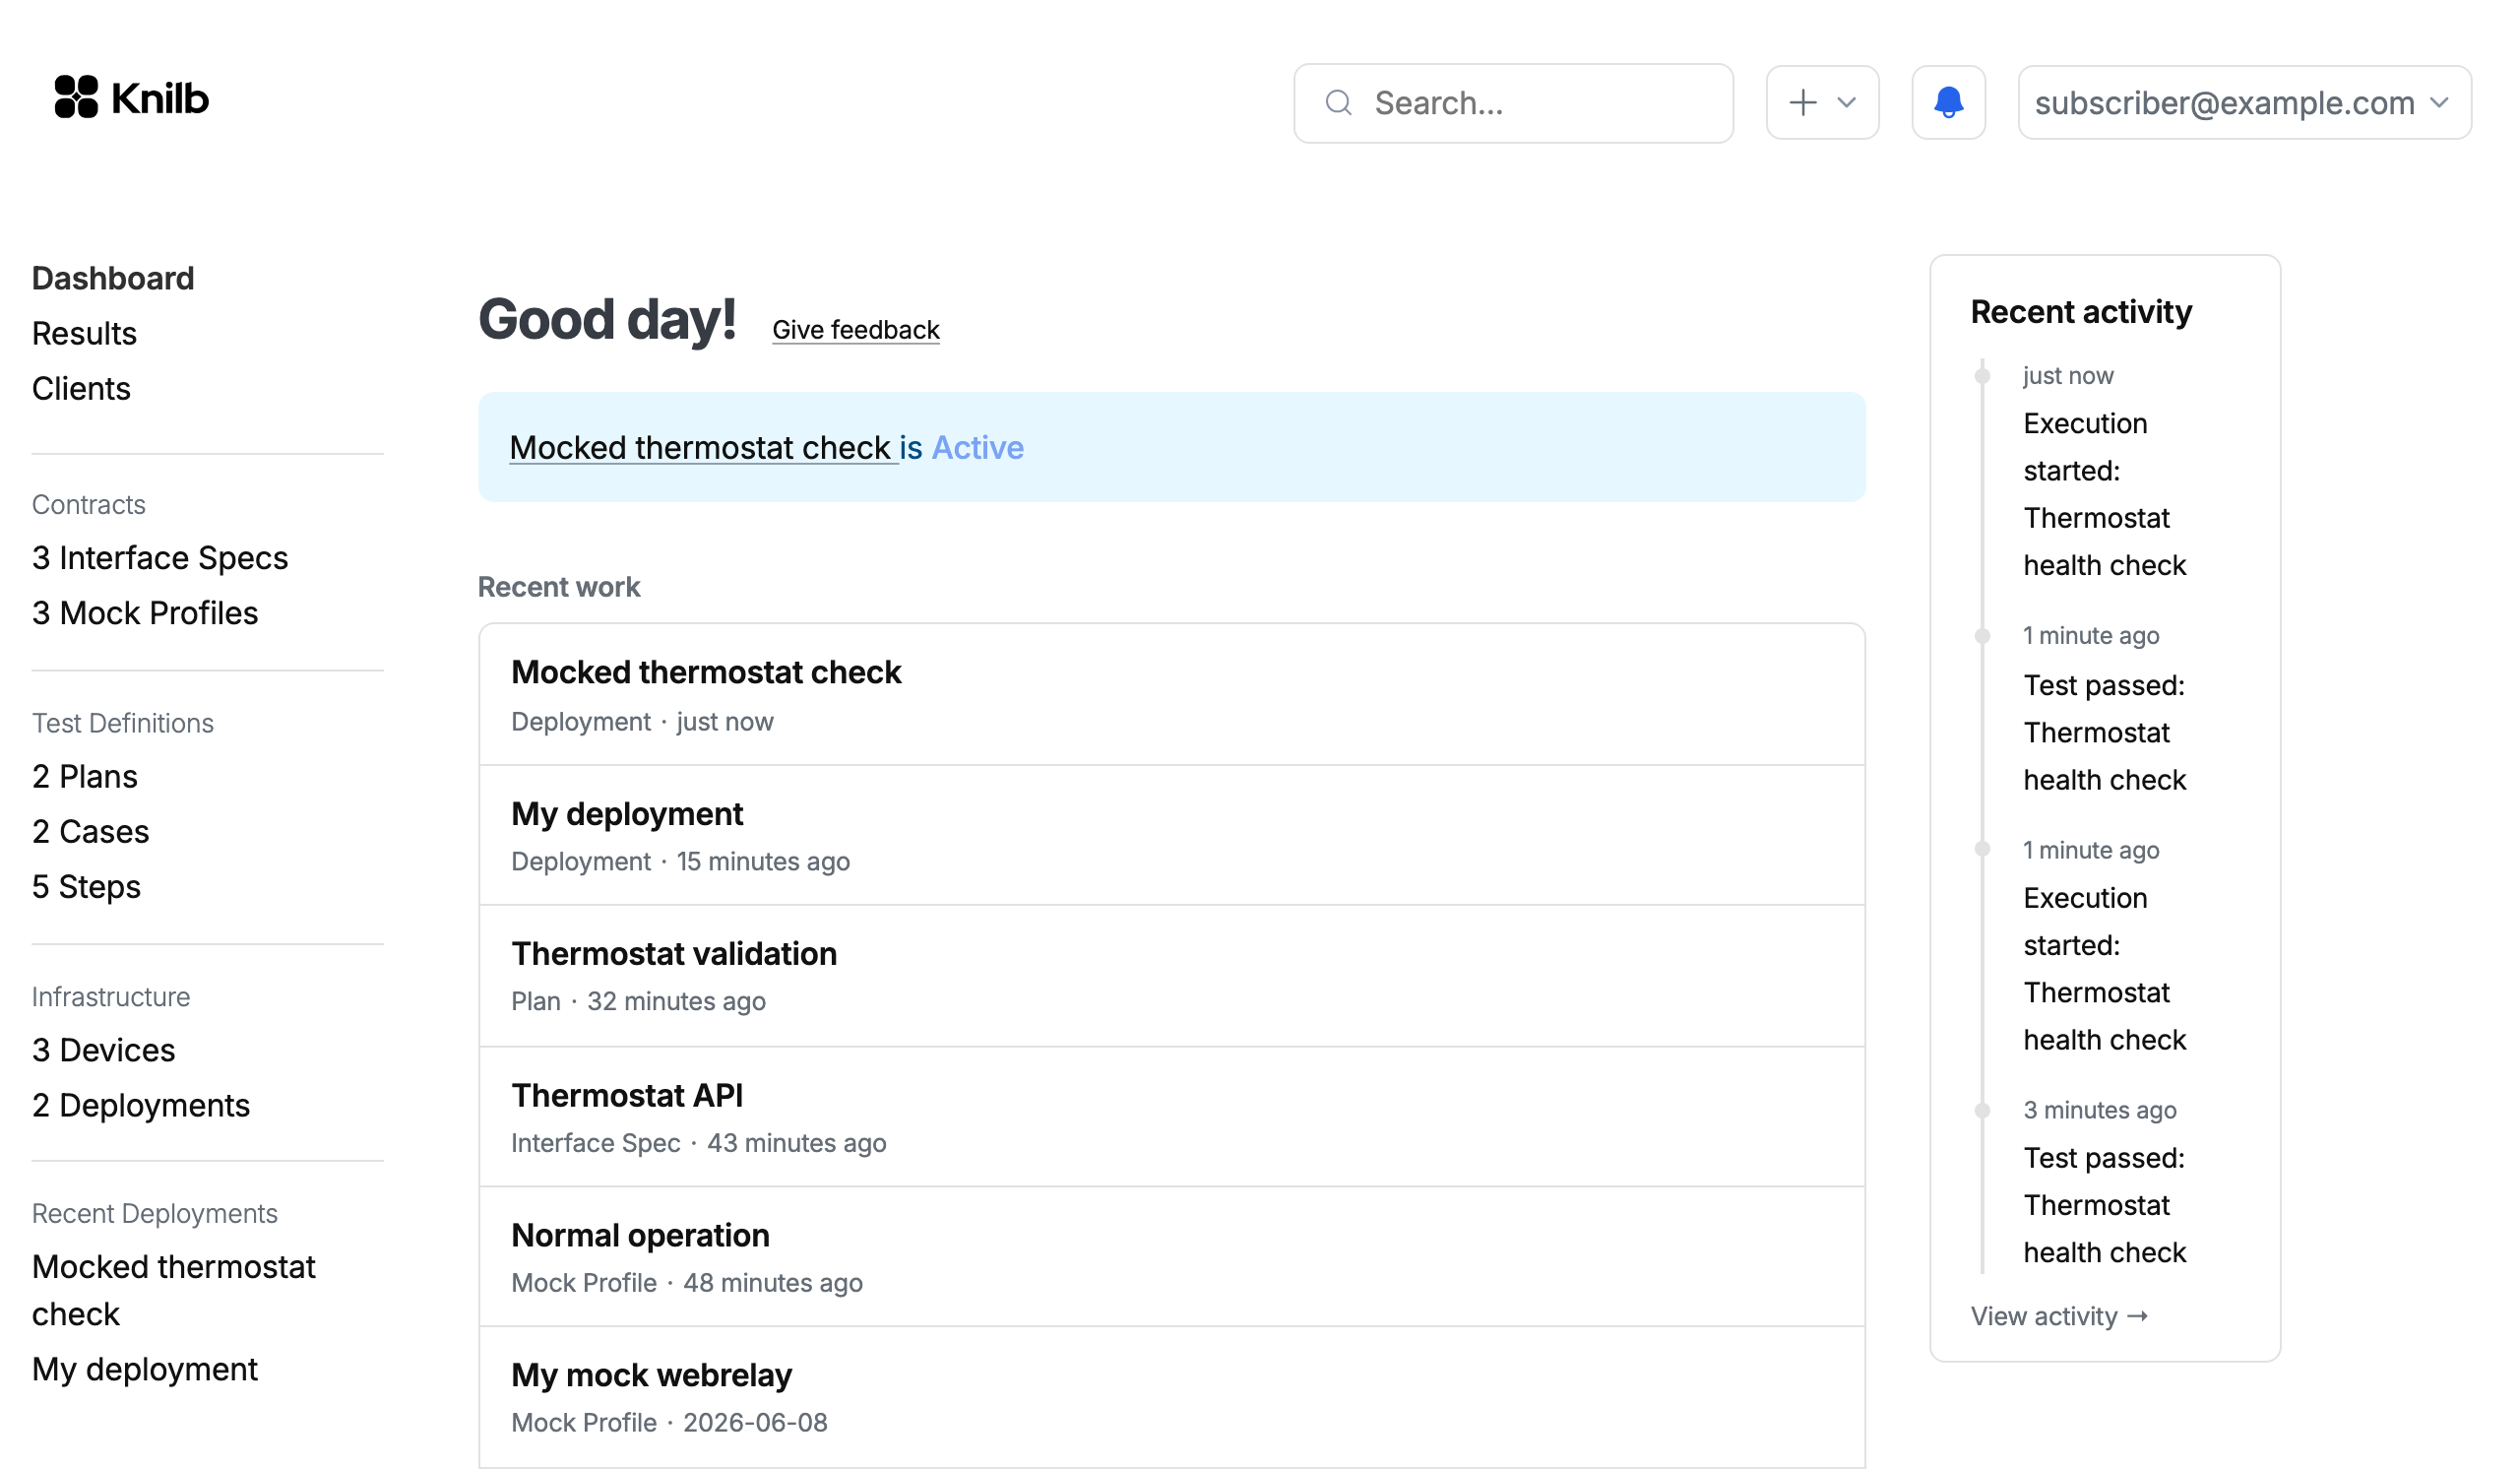
Running from the command line
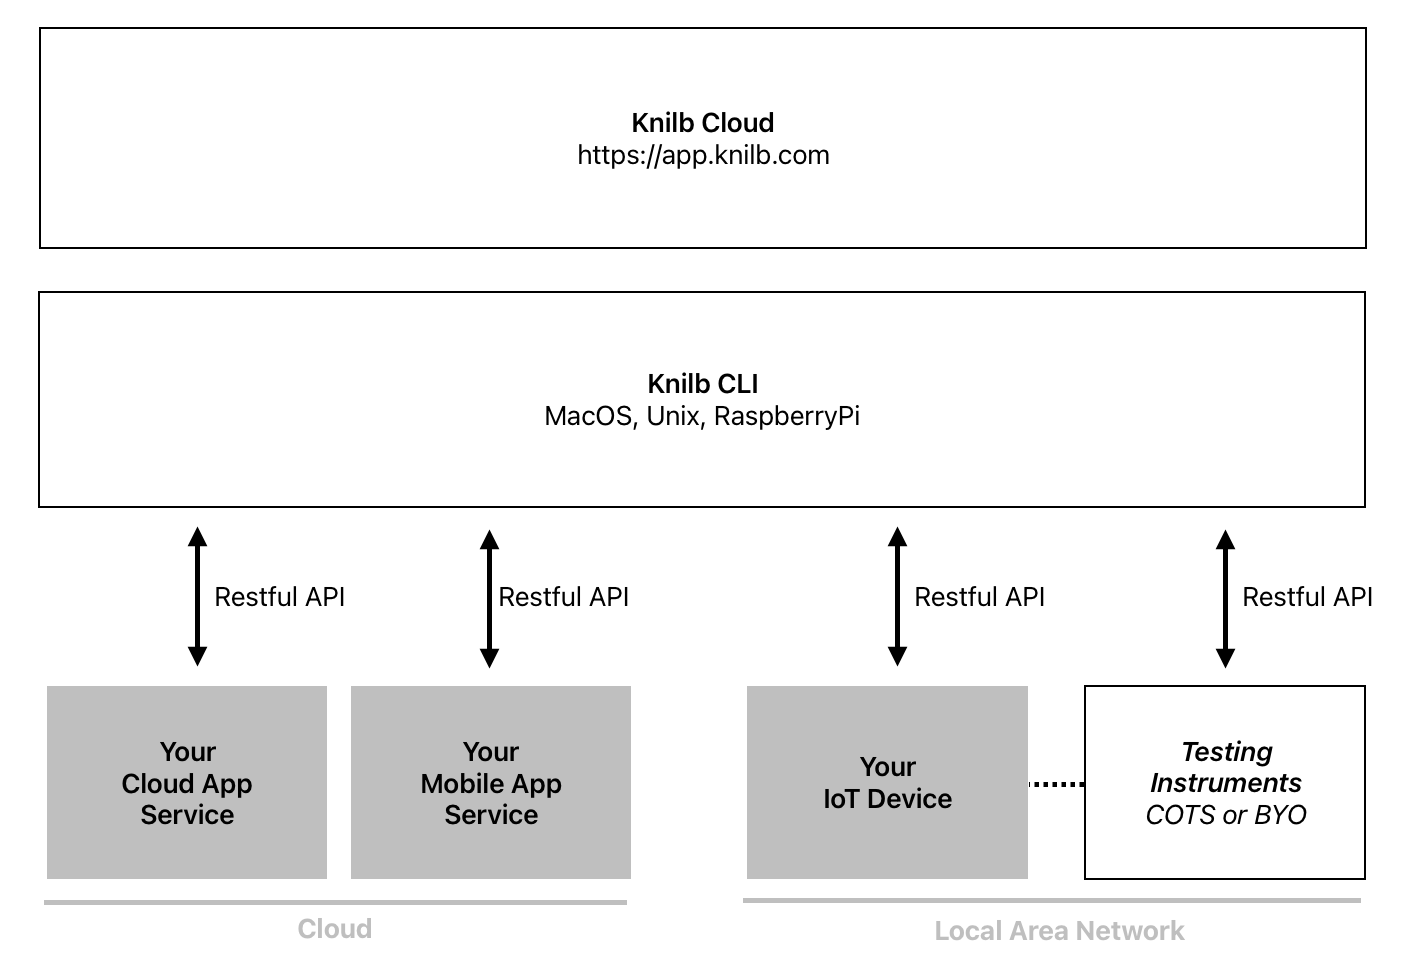
You run from a small command-line tool on a machine in your lab. It works through the plan against the real parts, or against mocks, and reports every step back to the web app, where the results live.
Test cases: Thermostat health check
Preparing: Thermostat health check
Running: Thermostat health check
Completed: Thermostat health check
All test cases completed.
The same run, every time
A result is only worth trusting if the run behind it is the same every time. Here is what that means for your team.
- Same plan, any bench: tests name roles, not machines, so they run unchanged from mocks to hardware
- Authored from the contract: forms offer only what the API declares, so tests cannot drift from it
- One failure, one readable log: the first failing step ends the case, so you read a cause, not a cascade
- Mocks cannot leak: a mocked role never reaches the real device, even when nothing matches
- Every step says who answered: the device, a proxy, or a file, so you know what you tested
- A result you can reopen in a year: every result freezes what was cast and what each step saw
Reaching the hardware
Test equipment is a participant like any other. An instrument that exposes its own API contract is cast into a role and does the translation between the wire and the API: a relay closing, a line changing state, an LED lighting, observed by the instrument and asserted on by the step rather than inferred from what the software reports.
That works for equipment off the shelf and for the fixtures you already have. A commercial instrument and a board your team built are both castable into the same role, and the scripts around them are the cheap part to reproduce. What Knilb adds is what scripts never had: a testbed inventory, plan management, runs that move between benches without being rewritten, and a history of every run. Ask, and we will show it running live.
Alongside the tools you already have
Knilb does not replace what your team already runs. It adds the layer that was missing above it: the whole system, exercised in one run, with a record of what happened. Your test management tool still holds the plan of record, and Knilb holds what actually ran against it. Your protocol analyzer still owns the radio, and Knilb checks what the system did once the command got through. Your API client is still the fastest way to try one endpoint, and Knilb is what you reach for when the question is whether all of them work together.
If that is the bench you have been meaning to build, we are working with a small number of design partners.